


Graph 1
Graph 1 shows about five hundred years of temperature data for Greenland's interior derived from
ice core analysis by NOAA. Notice the alarming rise in temperature starting mid-nineteenth century.
That's why the Global Warming establishment loves to quote data that starts with 1850. So, is this rise
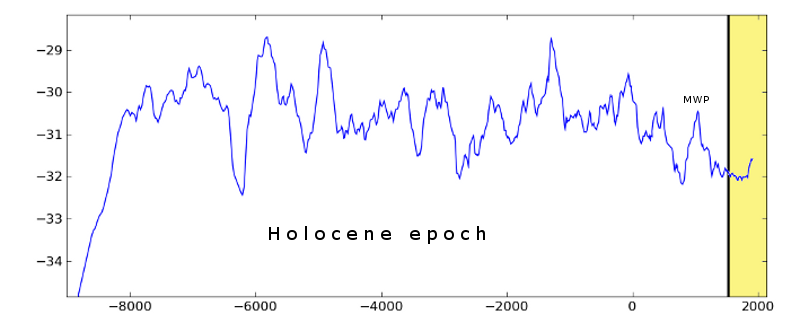
in temperature something that should scare us? Graph 2 adds a little perspective.
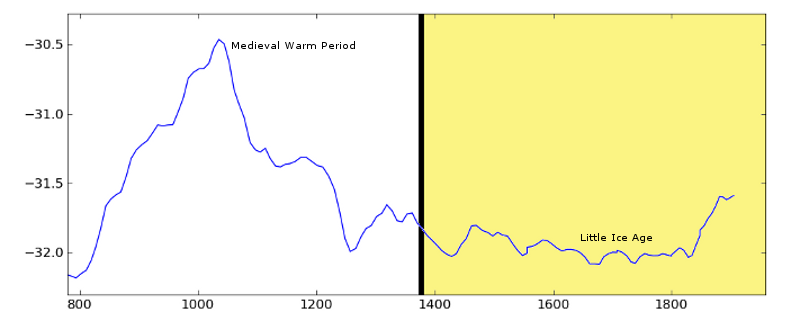


Commentary & shading mine - data plotting courtesy of J. Storrs Hall.